There are situations where we can not be satisfied with weather forecasts. To plan a trip sometimes we have to know how to look to the past to understand the dynamics of the dominant weather elements changing across time and seasons.
The forecasts have a time limit. Usually no forecast should be trusted for more than 4/5 days . But when we are planning long journeys, or need to decide which is the best time to sail in an ocean, future predictions are not enough. We need to obtain a general understanding of the conditions prevailing during different periods of time. We therefore have to gather information by looking at past experience about weather conditions that we will find in a given period in an ocean, or along a route. In a sense, to safely navigate the future we have to make treasure of the past weather information.
If we want to cross the Atlantic on the route of the trade winds, which is the most favorable period of the year? When does the hurricane season ends? And when it starts?
If we plan a long trip, which will see us busy for a long time at sea, we must carefully choose the most favorable seasons to cross oceans and navigate safely. Short and medium range weather forecasts, we can recover in the course of our navigation, are not enough. First we need to understand what are the most favorable seasons and the months where we will meet the most benign weather for our navigation. To do this we must study the past weather, looking at the experiences accumulated over the years by those who have sailed before us and making use of climate data from the past, or by studying the Pilot Charts.
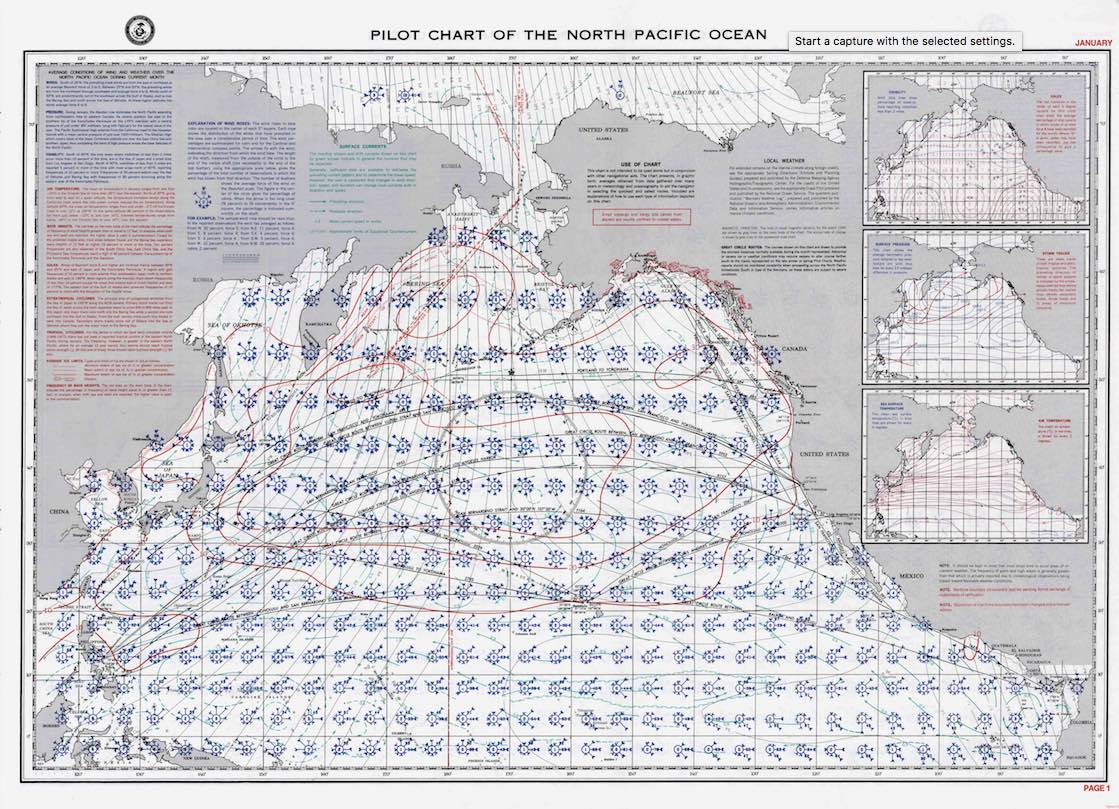
These are one of the reference points for all sailors interested in wind and currents conditions in all the months of the year and in the different oceans. They offer a simple and immediate way to see wind conditions (intensity and direction) and tides and ice on all the seas of the world, for all twelve months of the year. These charts were compiled by collecting data accumulated over time from boats that have sailed these seas, and report the monthly average values of the wind, currents and ice limits.
Pilot Chart, North Pacific, January
Pilot Chart can be downloaded in PDF format from the following link
The Pilot Chart offers a reasonable amount of information, but have limitations that we must take into account. The displayed data are monthly averages, built on non-homogeneous data. Unfortunately the majority of the data collected was concentrated along the commercial routes, where the transiting vessels have over time provided information. In other areas of the globe, little frequented by ships, the data used for the compilation of the Pilots are sparse or unreliable. However, the monthly average data provided by the Charts Pilots remain a useful tool for preliminary analysis of an ocean or sea area.
Today, however, we can do more. Thanks to the weather information systematically collected and made available in electronic format, we can view weather data of the past in a convenient and flexible format, such as GRIB files, and use this information to simulate our future cruises, day by day, in any region of the world .
To plan my future navigations I compiled wind speed and direction obtained from the GFS model in GRIB format for different periods of the past. This information can be of great use to those who wish to view the wind conditions of the past in preparation of crossings, or to plan cruises in certain areas of the planet.
With this contribution I want to make available to sailors an additional tool that can help them in route planning. The files that I prepared are a “modern” version of the classic and digital Pilot Chart, with the advantage of the electronic format which makes it possible to analyze with modern software the past weather conditions and to plan “virtual” navigations in the past. Furthermore, the data that I have collected are very detailed, being divided by month and day on a finer spatial grid. It is a remarkable improvement compared to the Pilots, which offer instead simple monthly averages on large scale charts.
From the GFS model, for some past years past, I compiled the wind speed and direction for each day of the year on a three-hour interval: 3:00; 6:00; 9:00; 12:00; 15:00; 18:00; 21:00; 24.00 (UTC).
The GFS model is initialized and updated with new data every six hours. Precisely at: 00; 06; 12 and 18 UTC. In order to provide the most realistic representation of the wind conditions on the globe I have only included the forecast data next to the model update times, according to the following schedule:
- Forecast at 03 and 06 processed from the model at 00.
- Forecast at 09 and 12 processed from the model at 06.
- Forecast at 12 and 15 processed from the model at 12.
- Forecast at 18 and 12 processed from the model at 18.
- Forecast at 21 and 24 processed from the model at 18.
For every day of the year, and for all 365 days of the years I have compiled for every three hours the wind forecast data in GRIB format. In this way we can have a very accurate wind data base useful for planning in detail any navigation in the globe.
The GRIB files that I made are broken down by month. They are quite heavy files, on average 120 Megabite for each month. They are therefore to be download only with a good internet connection. I think they are a very useful tool for those who want to plan and simulate routes and crossings worldwide.
The data is in GRIB format 2. Not all software that read GRIB files is able to read this newer format. Moreover, given the size of the files, not all programs are able to view them. I have not experimented a lot with the different GRIB viewer software available. I limited myself to use these data with a couple of Mac software that I use for weather analysis: LuckGrib and qtVlm.
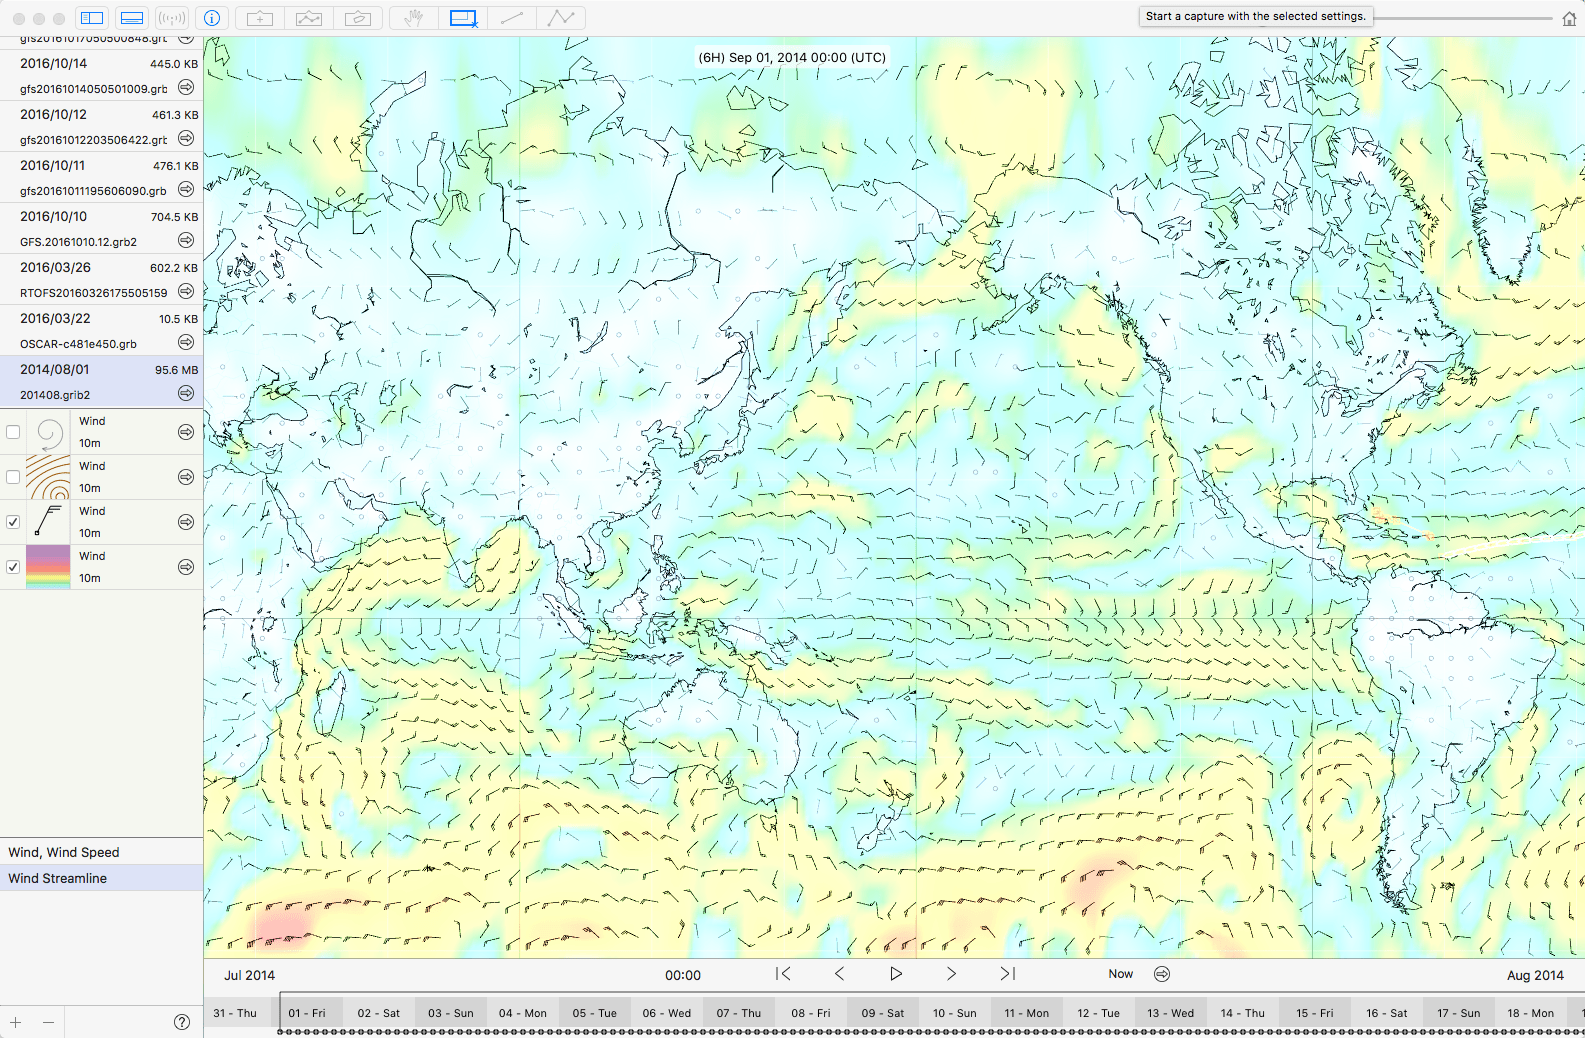
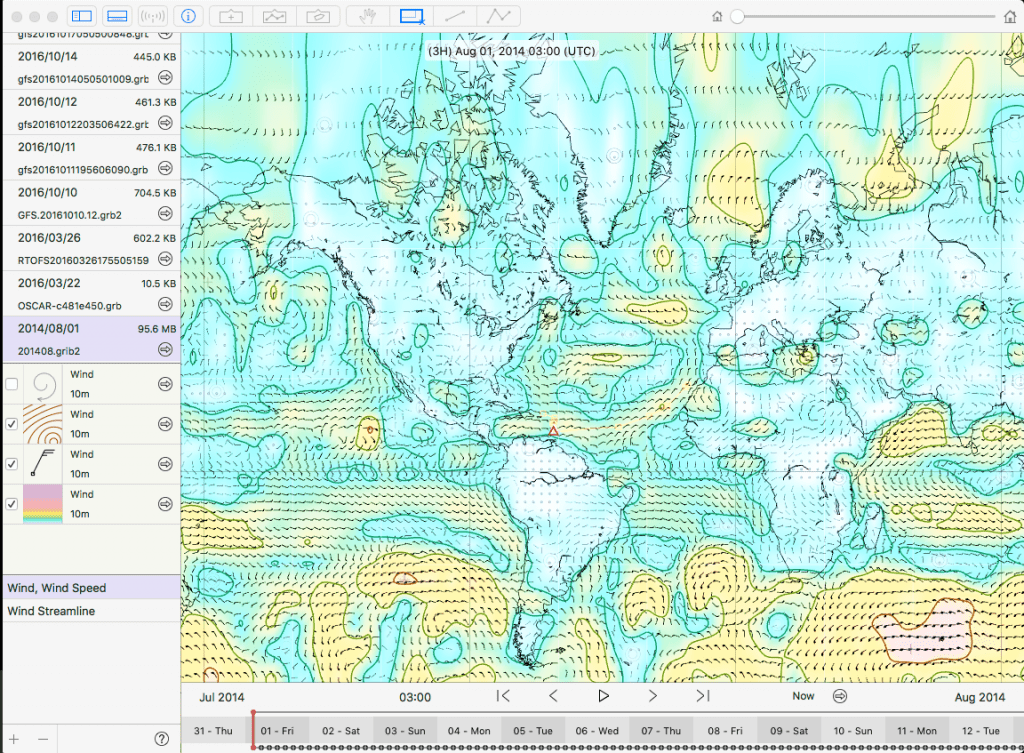
GFS global model, wind, August 2014 – in LuckGrib
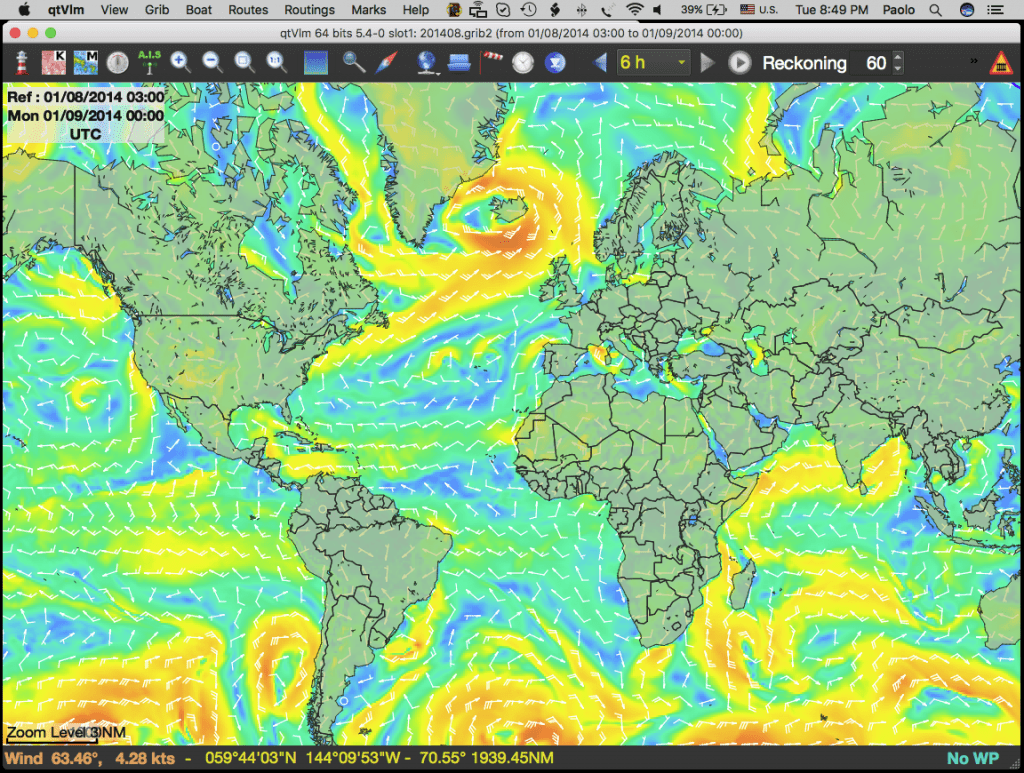
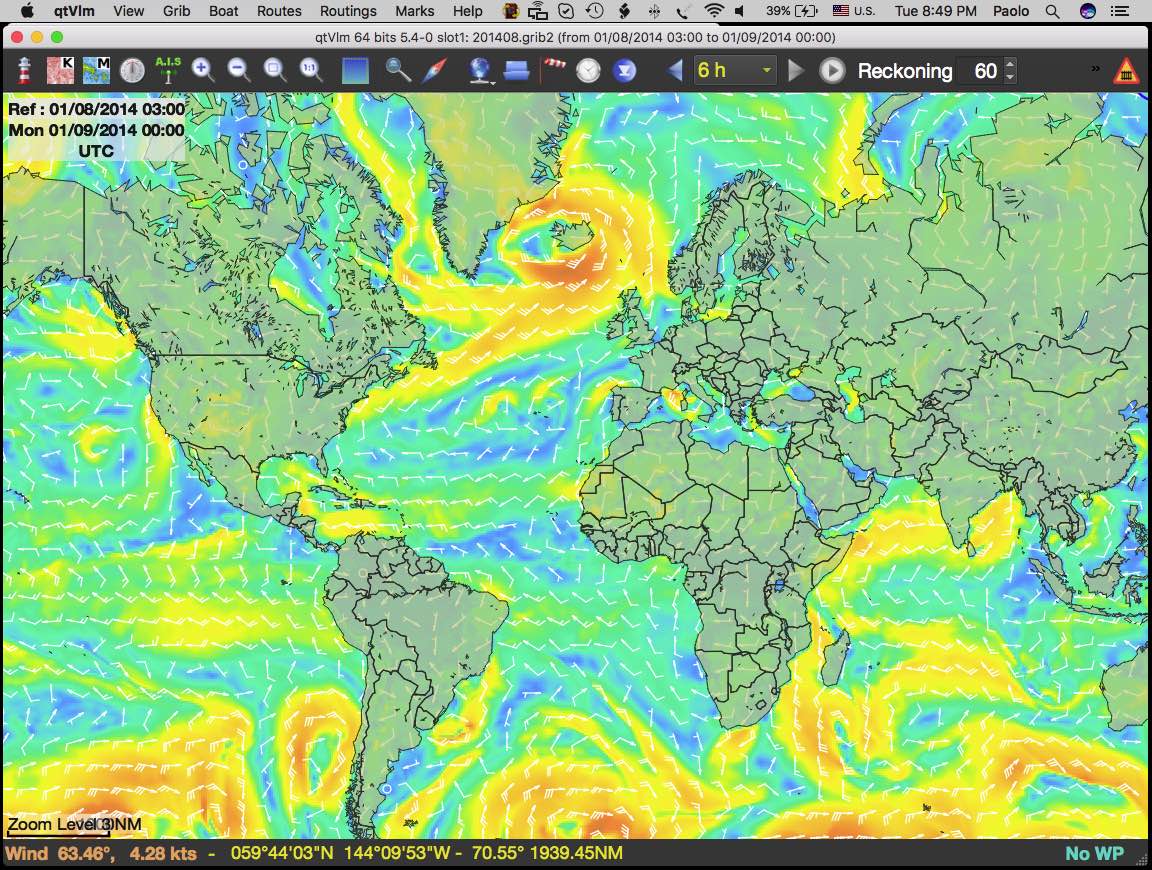 GFS global model, wind, August 2014 – in qtVlm
Display of wind data in August 2014, GFS model with LuckGrib
Route planning (Las Palmas – Bermuda) in August 2014, with GFS wind data with qtVlm
I hope that the data proposed here may assist sailors engaged in planning and simulating routes and crossings. I have compiled wind weather data for 2014, 2015 and 2016. If you are interested to these files you can email me directly: Paolo.
Esistono situazioni dove non possiamo accontentarci delle previsioni future. Per pianificare un viaggio a volte dobbiamo saper volgere lo sguardo al passato per guardare la dinamica degli elementi meteo dominanti al cambiare del tempo e delle stagioni.
Le previsioni hanno un limite temporale. Di solito oltre 4/5 giorni nessuna previsione è da considerarsi attendibile. Ma quando programmiamo delle lunghe traversate o per decidere quale’ il momento migliore per navigare in un oceano, le previsioni future non bastano. Abbiamo bisogno di farci un’idea generale delle condizioni prevalenti nel periodo temporale prescelto. Dobbiamo quindi documentarci in merito alle condizioni meteo che troveremo in un determinato periodo in un oceano, o lungo una rotta, guardando all’esperienza passata. In un certo senso, per navigare in sicurezza nel futuro debbiamo fare tesoro del passato.
Se vogliamo attraversare l’Atlantico sulla rotta degli Alisei, qual è il periodo più favorevole? Quando termina la stagione degli uragani? E quando ricomincia?
Se pianifichiamo un lungo viaggio, che ci vedrà impegnati per lungo tempo in mare, dobbiamo scegliere accuratamente le stagioni più favorevoli per attraversare gli oceani e navigare in sicurezza. Non bastano le previsioni a corto e medio raggio, che possiamo recuperare nel corso della navigazione. Prima di tutto dobbiamo capire quali sono le stagioni più favorevoli e i mesi dove incontreremo il tempo più benigno per la nostra navigazione. Per far questo dobbiamo quindi studiare il passato, guardando all’esperienza accumulata negli anni da chi ha navigato prima di noi, facendo ricorso ai dati climatologici del passato, o alle Pilot Charts.
Queste sono uno dei punti di riferimento per tutti i marinai interessati alle condizioni del vento e delle maree nei diversi mesi nell’anno e per i diversi oceani. Esse offrono un modo semplice e immediato per visualizzare le condizioni del vento (intensità e direzione) delle maree e dei ghiacci su tutti i mari del mondo, per tutti i dodici mesi dell’anno. Queste carte sono state compilate raccogliendo i dati accumulati nel tempo dalle imbarcazioni che hanno solcato questi mari e riportano i valori medi mensili dell’intensità del vento, delle correnti e dei limiti dei ghiacci.
Pilot Chart del nord Pacifico a Gennaio
Le Pilot Chart possono essere recuperate nel formato PDF al seguente link
Le Pilot Chart ci offrono una ragionevole quantità di informazioni, ma presentano limiti di cui dobbiamo tenere conto. I dati visualizzati sono delle medie mensili, costruite su dati non omogenei. Purtroppo poi la maggioranza dei dati raccolti si è concentrata lungo le rotte commerciali, dove le imbarcazioni transitanti hanno nel tempo trasmesso informazioni. In altre zone del globo, poco frequentate da navi, i dati usati per la compilazione delle carte sono invece sparuti o poco attendibili. Comunque i dati medi mensili offerti dalle Pilots Charts restano un utile strumento per un’analisi preliminare di un oceano o di un’area.
Oggi però possiamo fare di più. Grazie alle informazioni meteo sistematicamente raccolte e rese disponibili in formato elettronico è possibile visualizzare i dati meteo del passato in un formato conveniente e flessibile, come i files GRIB, e con questi simulare le nostre navigazioni future, giorno per giorno, in qualunque regione del mondo.
Per pianificare le mie navigazioni future ho compilato i dati del modello GFS del vento in formato GRIB per diversi periodi del passato. Quest’informazione può essere di grande utilità per quanti vogliano visualizzare le condizioni del vento passate in preparazione di traversate, o per pianificare crociere in determinate aree del pianeta.
Con questo mio contributo voglio mettere a disposizione dei velisti uno strumento aggiuntivo che possa aiutare nel lavoro di pianificazione delle rotte. I files che ho preparato sono una versione “moderna” e digitale delle classiche Pilot Chart, con il vantaggio del formato elettronico che rende possibile l’analisi con i moderni software per la navigazione, svolgendo vere e proprie navigazioni “virtuali” nel passato. Inoltre i dati che ho raccolto sono molto dettagliati, essendo divisi per mese e giorno su una griglia spaziale più fine. Si tratta di un notevole miglioramento rispetto alle Pilots, che invece offrono delle semplici medie mensili su larga scala.
Dal modello GFS, per alcuni anni passati, ho ricompilando le informazioni di previsione disponibili per ogni giorno dell’anno su un intervallo di tre ore: 03.00; 06.00; 09.00; 12.00; 15.00; 18.00; 21.00; 24.00.
Il modello GFS è aggiornato e inizializzato con nuovi dati ogni sei ore. Precisamente alle: 00; 06; 12 e 18. Per offrire la rappresentazione più realistica delle condizioni del vento sul globo ho quindi incluso solo i dati di previsione prossimi agli orari di aggiornamento del modello, secondo il seguente schema:
- Previsione delle ore 03 e 06 elaborata sull’aggiornamento del modello alle ore 00.
- Previsione delle ore 09 e 12 elaborata sull’aggiornamento del modello alle ore 06.
- Previsione per le ore 12 e 15 elaborata sull’aggiornamento del modello alle ore 12.
- Previsione per le ore 18 e 12 elaborata sull’aggiornamento del modello alle ore 18.
- Previsione per le ore 21 e 24 elaborata sull’aggiornamento del modello alle ore 18.
Per ogni giorno dell’anno, e per tutti i 365 giorni degli anni considerati ho così compilato per ogni tre ore i dati di previsione del vento nel formato GRIB. In questo modo possiamo avere una base di dati del vento molto accurata e utile per pianificare in dettaglio qualunque navigazione nel globo.
I file GRIB che ho preparato sono suddivisi per ogni mese dell’anno. Si tratta di file molto pesanti, in media 120 Megabite per ogni mese. Sono quindi da scaricare solo con una buona connessione internet. Li ritengo uno strumento utilissimo per chi voglia dilettarsi a pianificare e simulare rotte e traversate in tutto il mondo.
I dati sono nel formato GRIB 2. Non tutti i software che leggono i files GRIB sono in grado di leggere questo formato recente. Inoltre, data la dimensione dei files, non tutti i programmi riescono a visualizzarli. Non ho sperimentato molto con i diversi software disponibili. Mi sono limitato a usare questi dati con un paio dei software per Mac che uso per l’analisi meteo: LuckGrib e qtVlm.
Modello globale GFS del vento, Agosto 2014 – in LuckGrib
 Modello globale GFS del vento, Agosto 2014 – in qtVlm
Visualizzazione dei dati del vento nell’agosto 2014, modello GFS con LuckGrib
Pianificazione di una rotta (Las Palmas – Bermuda) nell’agosto 2014, modello GFS con qtVlm
Spero che i dati che qui propongo possano essere di utilità per i velisti impegnati nel pianificare e simulare rotte e traversate. Ho compilato per il globo i dati delle condizioni del vento relative al 2014, 2015 e 2016. Se vi interessano questi file potete scrivermi direttamente: Paolo.

